Signal Processing controls
From top to bottom, Signal Processing windows consist of a channel select button, channel name display, an equalizer graph, a row of equalizer band controls, and a collection of text fields and processing controls.
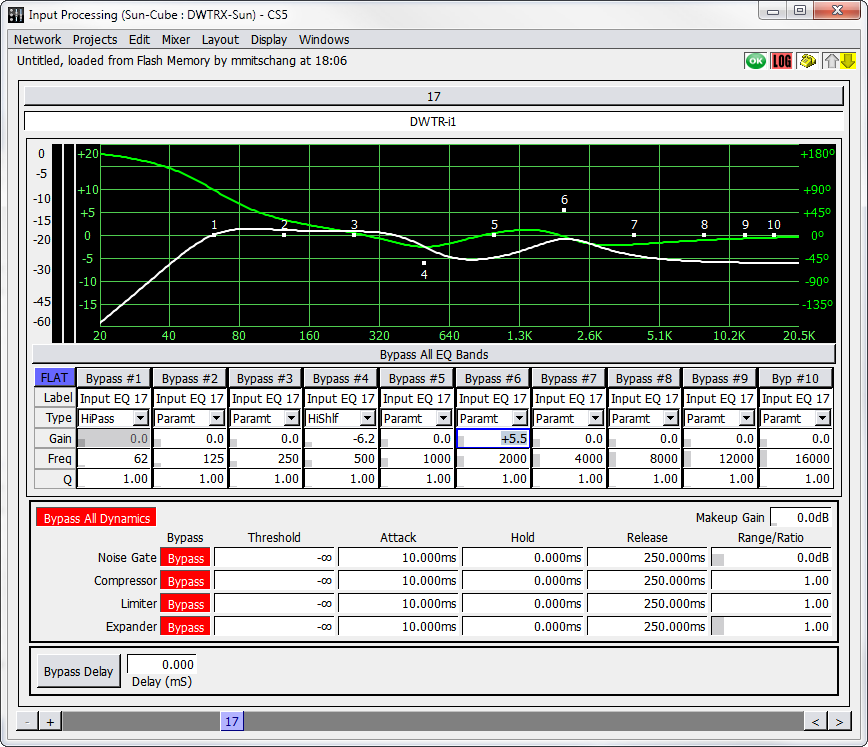
Signal Processing Controls (Input Processing Window Shown)
Processing controls for adjusting signal equalization, delay, and dynamics are available in the following windows:
Input Processing (shown below)
Bus Processing
Output Processing
Aux Processing
Listen Processing
VRAS Processing
Processing and channel strips
Channel strips in the signal processing windows contain the following components, from top to bottom.
Component | Function |
|---|---|
Channel Select button | Each button is labeled with the Channel Number. Selecting a channel in the Processing window is equivalent to selecting the channel in its corresponding displays gain reduction due fader window. |
Channel Label box | Faders can be automatically named when configuring the mixer. Click the text box and enter a custom name. |
Two signal meters | Meters display signal level to the left of the equalizer graph; one meter for channel level and another that displays gain reduction as a result of dynamics processing. |
Bypass All EQ Bands button | Disables EQ for the channel. |
EQ band controls | Bypass button. When selected, the corresponding equalizer control point is disabled. |
Band Label text box. | |
EQ Type selector. Contains various equalization algorithms (Parametric, Low Shelf, High Shelf, Notch, Low Pass, High Pass, and Band Pass). | |
Gain, Freq, and Q value boxes. Drag values up or down to change them. Val- ues can also be entered manually. The Gain value is disabled for Notch, Low Pass, High Pass, and Band Pass filter types. |
Component | Function |
|---|---|
Dynamics band controls for Noise Gate, Compressor, Limiter, and Expander | A Bypass All Dynamics button, for disabling all of the band dynamics at once. |
Bypass buttons to bypass selected dynamics processing: Noise Gate, Compressor, Limiter, and Expander. | |
Threshold, Attack, Hold, Release, Range/Ratio, and Makeup Gain value boxes. Adjust by dragging or by typing a value directly. | |
Delay controls | Bypass Delay button. Disables the delay on that channel. |
A Delay value box. Enter 0 to disable delay for the channel, or a decimal value to set delay in milliseconds. |
Tip
To make changes in smaller increments, hold down the Option/Alt key when dragging values. Page Up and Page Down keys can also be used to make incremental changes.
Display menu
The following table describes the commands available in the Display menu of the Input Processing and Bus Processing windows.
Command | Description |
|---|---|
Show EQ Graph | Display visual representation of frequency and gain. |
Show EQ Phase | Display green phase line behind the EQ graph line. |
Show EQ Band Settings | Display controls for all EQ processing. |
Show Delay Settings | Display controls for delay processing. |
Show Delay Distances | Display delay as distances, in both feet and meters. Changing the time field affects the distance field, and vice versa. |
Show Dynamics Settings | Display controls for dynamics processing. |
Show Meters | Display signal and compression meters. |
Show Peak Hold | Display Peak Hold mark. |
Set Peak Hold Duration | Enter a time for the Peak Hold mark to remain visible. |
Show User CSV Traces | Display user-added graph data. |
User CSV Trace Settings | Import a file to create an additional EQ trace. |
Show Page Group controls | Display Page Group controls at the bottom of the window. See Page Group Controls, for more information. |
Keyboard and mouse commands
Processing controls can be navigated and edited in multiple ways.
Arrow and Tab keys navigate the various value boxes.
Hold down Shift when changing a value to adjust channels as stereo pairs.
Hold down Option (Mac) or Alt (Windows) when changing a value to make smaller changes.
Right-click a control point value and drag from one channel to another to copy the setting.
Drag EQ points in the EQ graph to adjust Frequency (X axis) and Gain (Y axis). Hold Shift while dragging to adjust channels in pairs.
Right-click and drag EQ points in the EQ graph to adjust Q (X axis) and Gain (Y axis). Hold Shift while dragging to adjust channels in pairs.
Tip
To adjust an arbitrary number of channels at once, click the channel select buttons for multiple channels and hold Command (Mac) or Ctrl (Windows) while adjusting control points. To adjust values relatively, hold Command+Option (Mac) or Ctrl+Alt (Windows).
User Traces
When configuring EQ settings, it can be helpful to view a reference trace in addition to the actual processing trace. Traces can be added in the form of CSV files. There are several programs that can output EQ data as a CSV file, such as Matlab or SIM3.
In the Input Processing window, choose Display > User CSV Trace Settings.
Click Choose Directory, and then navigate to the directory where the trace files are stored.
Click Choose File to choose a CSV file. The CSV data is now visible in the EQ graph. If not, adjust the Gain Offset up or down until the trace is visible.
Click Color to select the display color of the trace.
To view multiple traces at once, click Add Another Trace and follow the same steps. A different color can be assigned to each trace.
Channel-specific traces
Adding a user trace typically results in the same trace being visible on all channels. Different traces can be assigned to different channels by using a specific file naming technique.
To assign traces to specific channels:
Rename the CSV files with the same prefix, and append each with an underscore followed by the channel number. For example:
Trace_25.csv
Trace_26.csv
Trace_27.csv
In the User CSV Trace Settings window, click Choose Directory and navigate to the directory where the trace files are stored.
In the File text box, type
Trace_%CHAN%.csv. CueStation automatically replaces the
%CHAN% text with the channel number. This means that Trace_25.csv appears only on channel 25, Trace_26.csv appears only on channel 26, and so on.