Monitoring D-Mitri systems
CueStation provides several ways of monitoring the activity and health of D-Mitri systems, including connection status indicators in the bottom corner of every window. There are also several windows dedicated to providing feedback about the state of the system.
CueStation connection status
When CueStation is connected to a server, the name of that server is displayed in the title bar of every CueStation window, next to the window title. This makes it easy to tell whether the CueStation client is connected or not. One basic method of monitoring network activity exists in every CueStation window as a status bar.
Status Bar
The two arrows in the status bar are communication status arrows. The upward (upload) arrow represents communication from CueStation to the server, and the downward (download) arrow represents communication from the server to CueStation. The arrows are gray unless there is active communication between the window and the server, in which case they turn yellow or green.
An arrow's background color also carries meaning. A yellow background, for example, indicates that metering has fallen back to TCP as a result of UDP packet loss. In the case of a window failing to receive a response from the server for four seconds, the background of the downward arrow changes color, as shown below.
In tandem, the color of an arrow and its background show which server background process is not responding. MixerD is the D-Mitri process that manages mixing functions; CueD is the D-Mitri process that manages cue functions.
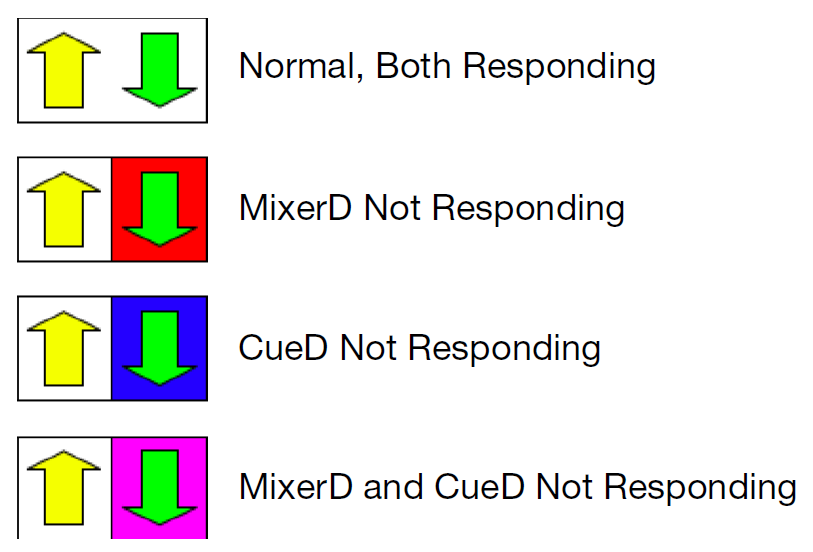
Status Arrows and Associated Connection Status
Click the communication status arrows to open the System Status window, where more complete system information is displayed. For more information, see System Status Window.
Log alert, Page alert, and Status alert
To the left of the connection status arrows, there are three icons: a System Status icon, a telephone, and a LOG icon.
The System Status icon shows a green OK symbol when CueStation is running normally. It shows a red blinking background during a Critical level Alert condition, and a yellow background during a Warn level Alert condition. Click this icon to bring up the System Status window. To change the threshold for system status alerts, right-click this icon when the System Status window is up. Select the threshold from the menu. For example, when selecting Alert on Critical Error Condition, the system status icon only blinks when a Critical Error occurs.
Whenever a log entry of Warning level or higher is printed to the log, the LOG icon flashes the corresponding color on all connected CueStation windows. Click the icon to open the Log window and clear the flashing.
Similar to the system status threshold, the threshold of log alerts can be changed by right-clicking the LOG icon. For example, if Blink on Critical Error is selected, the LOG icon only blinks when a Critical Error message appears in the log. See Log window, for more details about error messages.
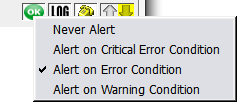 |
Log Alert Threshold
The telephone icon allows quick access to the Chat window. When one user pages another, the recipient’s CueStation windows flash cyan once, and the telephone icon continues to flash until the Chat window is opened. Hovering the mouse over the telephone icon shows a tooltip that displays the last several page instances with timestamps.
Log window
The CueStation log records all important system messages, both from CueStation and from D-Mitri modules. It provides a useful tool for troubleshooting hardware issues, communication problems, configuration errors, and cue automation issues. CueStation stores logs as files in the D-Mitri_Logs directory, within the CueStation_Settings directory. CueStation creates a new log for each session, and incorporates date and time stamps into the name of each log file.
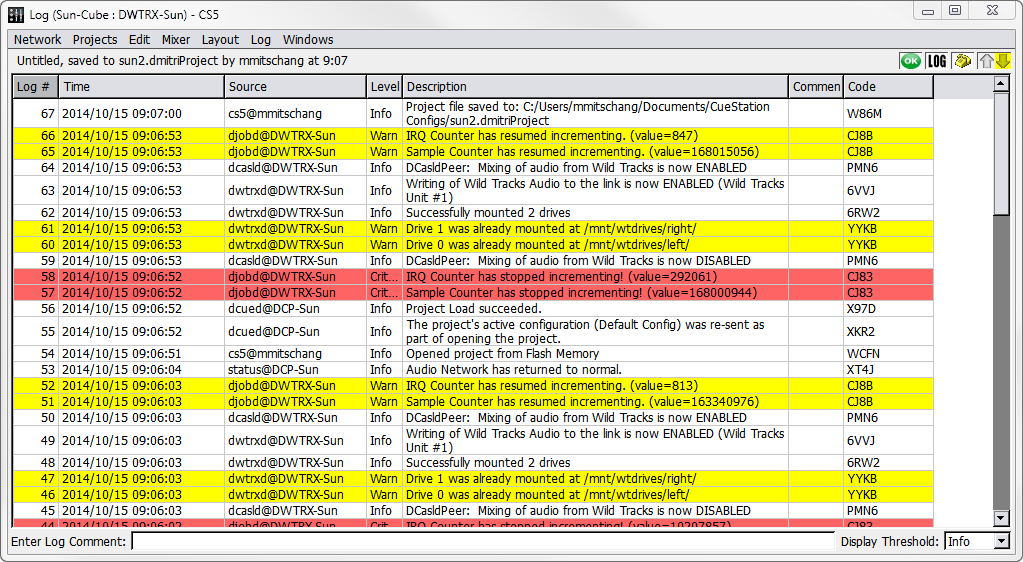
Log Window
Log entries
Click a column heading to sort the log in ascending order by that heading; click the heading a second time to sort it in descending order. Column sorting is indicated by a triangle icon, when column width permits. Columns can be arranged by dragging them from one position to another within the table.
The Log # and Time columns show the order in which the messages were received. The Source column indicates which software or hardware component sent the message, while the Level column shows the severity of the message and the Description contains the message. Log entries can be annotated in the Comment column. The Source Serial # column shows the serial number of the device CueStation read for each message. The Code column shows a code number associated with each log, useful for debugging and troubleshooting.
Adding log entries
The Log window also has an Enter Log Comment text field which can be used to easily enter comment lines into the log. The warning level of the comment entry can be set using the drop-down box to the right of the text box. Note that selecting an error level from the drop-down box also filters the error display to show only errors of the type selected.
To add an entry, type the comment into the Enter Log Comment text field and press Enter.
Types of log entries
There are six levels of log messages that might appear in the log window.
Level | Message Description |
|---|---|
Info | These messages contain information about normal system activity. This includes recalling a cue, or the completion of certain processes such as track-from-top or saving a project to flash. These messages have a white background. |
Warn | The Warn level is for messages that are important to note but do not necessarily indicate that an error has occurred (i.e., a version mismatch between the client and the server). These messages have a yellow background. |
Error | This level indicates that an error has taken place. Error messages do not necessarily mean that the system is in danger of failure. For example, an attempt to recall a nonexistent cue would be logged as an error, but such an occurrence does not jeopardize the function of any D-Mitri module or of a D-Mitri system. Error messages have a pink background. |
Critical | This level indicates a critical system failure. These messages have a red background. |
Debug | Debug messages contain debugging information only, and do not usually appear in normal CueStation operation. These messages have a green background. |
Trace | These messages are used to trace program execution and do not usually appear in normal CueStation operation. These messages have a cyan background. |
Log menu
The Log menu has several commands for managing the displayed messages.
Command | Description |
|---|---|
Enable Word Wrap | Continues each entry on a new line if the contents exceed the column width. |
Clear Log | Clear the log window of all log entries. This command clears the log for all CueStation clients connected to the target D-Mitri system, as opposed to clearing just the local Log window. |
Save Log | Save the log to a text file. |
Save Log As | Save the log to a text file, with a different file name. |
Save All Processor Logs | Save a single archive containing system log files for all D-Mitri processor modules. |
System Status window
The System Status window provides a remote view of the performance of D-Mitri modules included in the system configuration. Processor modules and Matrix modules are monitored in real-time.
Tip
Click the communication status arrows or System Status icon in any CueStation window to open the System Status window.
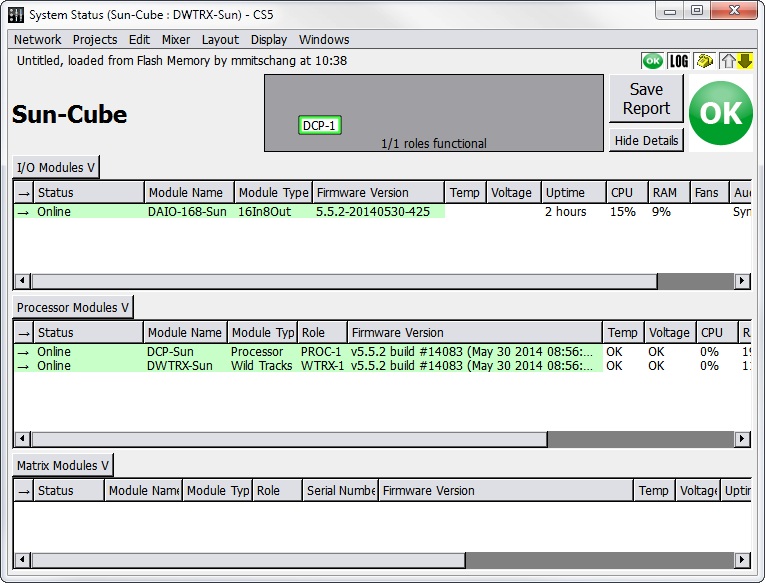
System Status Window
The window provides a live link state diagram, which displays which DCP modules are currently passing audio to which DCM modules. This diagram is particularly useful in operating D-Mitri systems containing redundant modules, as it shows which redundant modules are active.
Note
No system details are available when connected to VirtualD-Mitri. The System Status window shows no entries.
Under normal conditions, the entries display on a green background. The background color changes according to a unit's status. When D-Mitri is operating within its nominal range, OK is displayed for temperature, voltage, and fan speed. Error messages are displayed with detailed information if these values are outside expected ranges.
The following table describes the categories of data that appear in the System Status window.
Category | Description | |||||||||||||||||||
|---|---|---|---|---|---|---|---|---|---|---|---|---|---|---|---|---|---|---|---|---|
Status | Online or Offline. | |||||||||||||||||||
Module Name | Displays predetermined name. | |||||||||||||||||||
Module Type | Displays predetermined type. | |||||||||||||||||||
Role | Displays the role of a processor module as primary or backup. The role of a module as shown in the System Status window reflects its role as specified in the Mixer Configuration window, with minor differences in how some backup modules are denoted. Modules are presented in the Role column of the System Status window as shown below, with the corresponding name for each module as it is displayed in the Unit column of the Mixer Configuration window.
| |||||||||||||||||||
Serial Number | Module serial number. | |||||||||||||||||||
Version | Version and build information. | |||||||||||||||||||
Temp | If the temperature is outside the maximum working limits by 5% or less, the background is yellow with black text. If greater than 5% outside the working limits, the background is red with white text. | |||||||||||||||||||
Power | If the voltage is less than 5% of the working value, the background is yellow with black text. If greater than 1% over the working value, the background is red with white text. | |||||||||||||||||||
Uptime | How long the system has been active. Time is given in increments ranging from seconds to days. | |||||||||||||||||||
CPU | Percentage of CPU used. | |||||||||||||||||||
RAM | Percentage of RAM used. | |||||||||||||||||||
Fan Speed | Shows OK when fans are working properly. Displays an error in the event of a fan malfunction. | |||||||||||||||||||
Synchronization | Shows the difference between each module's system clocks. There should never be more than a few milliseconds in a properly functioning system. If the values go out of range, an error is written to the log. | |||||||||||||||||||
Audio Port Status | Shows which GNet audio connections (between a DCP and a DCM) are in use, down, or missing. Indicates which module is currently serving as the PTP Best Master Clock. | |||||||||||||||||||
FPGA Version | Displays the version of the FPGA firmware that a module is running. Note that I/O modules do not use FPGA firmware. |
Tip
To download all Engine Logs to a client computer, right-click a table background in the System Status window and choose Download all Engine Logs.
Recommended maximums
D-Mitri hardware may not function properly if any of the following temperature or voltage thresholds are exceeded.
Threshold Type | Maximum Values |
|---|---|
Temperature | Core1 through Core4: warn at 60ºC/140ºF, error at 72ºC/162ºF. MCH: warn at 90ºC/136ºF, error at 100ºC/212ºF. FCC: warn at 65ºC/150ºF, error at 75ºC/167ºF. CB: warn at 55ºC/131ºF, error at 75ºC/167ºF. |
Voltage | in0: expected is 1.8v, warn at ±5%, error at ±10%. in1: expected is 1.1v, warn at ±22%, error at ±23%. in2: expected is 3.3v, warn at ±5%, error at ±10%. in3: expected is 5.0v, warn at ±5%, error at ±10%. in4: expected is 12.0v, warn at ±5%, error at ±10%. in5: expected is 1.1v, warn at ±5%, error at ±10%. |
Channel meters
The meters provide real-time metering of Input, Output, Bus, and Aux signals. Input is scaled to trim levels. PAFL channel meters are displayed in the Aux Meters window.
The Input Meter itself, examples of which are shown in the image below, shows signals in the range -90 dBFS to 0 dBFS.
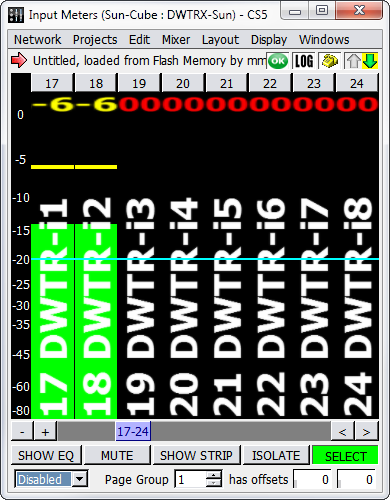
Input Meters Window
The meter scroll bar functions the same as blue scroll bars in other windows: The horizontal scroll bar has + and - buttons to add or remove channel strips from the window, as well as and buttons to scroll through the strips when they don’t all fit in the window.
Peak hold indicator behavior can be adjusted. Choose Display > Set Peak Hold Duration to change the peak hold time.
Choose Display > Show Peak Hold Bar to display a bar that indicates the peak level for the chosen duration.
Choose Display > Show Peak Hold Text to display the currently-held peak level of that channel in text above the meter.
Choose Display > Show Reference Line to display a horizontal reference line at a set level. The reference line defaults to -20 dB. Choose Display > Set Reference Level to set a cus- tom reference value in decibels.
Tablet controls
The Meter windows have additional channel editing controls, accessible through the Display menu. These controls are particularly useful for tablet/touch screen displays, but can also be used with a regular mouse.
When Display > Show Tablet Controls is enabled, the following five buttons are displayed across the bottom of the window.
Control | Description |
|---|---|
Show EQ | When the Show EQ function is active, touch or click a meter to open the corresponding channel processing window. This allows quick access to EQ, dynamics, and delay controls. |
Mute | When the Mute function is active, touch or click a meter to mute that channel. |
Show Strip | When the Show Strip function is active, touch or click a meter to open the corresponding mixer window, with the selected channel in the first column. |
Isolate | When the Isolate function is active, touch or click a meter to isolate that channel. |
Select | When the Select function is active, touch or click a meter to select that channel. Several channels can be selected at one time. |
UDP metering
CueStation's default metering setting is UDP multicast packets. UDP packets are multicast by the D-Mitri, and all of the clients listen to receive the metering information. This allows the meters to update faster and be more accurate. If network problems are encountered with metering, switch back to TCP metering by disabling Network > Use UDP Metering.
Display menu
The Metering windows contain a Display Menu, which provides the following commands.
Command | Description |
|---|---|
Show Meter Levels | Displays green meter bars. |
Show Compression | Displays compression activity. |
Show Names | Displays channel names. |
Show Channel Selects | Shows the Channel Select buttons. |
Show Horizontal Meters | Switches meters from vertical to horizontal array. |
Show Grid Lines | Displays horizontal grid lines that correspond with the decibel level markings. |
Show Reference Line | Displays a horizontal reference line at a set level. The reference line defaults to -20 dB. |
Set Reference Level | Sets a custom reference value in decibels. |
Show Peak Hold Bar | Shows a peak hold bar for each channel. |
Show Peak Hold Text | Displays current dB value of peak hold. |
Set Peak Hold Duration | Opens a dialog box to set the amount of time peak hold bars remain visible. |
Show Tablet Controls | Enables Tablet controls. See Tablet Controls, for more information. |
Show Channel Test Controls | Displays Channel Test controls above the meters. See Testing with Internally Generated Signals, for more information. |
Show Page Group Controls | Displays group controls. See Page Group Controls, for more information. |